What it costs to have an AI agent system build and ship a client app
A client asked for an app. A multi-agent system built it, deployed it, and ran it at a live event. The model cost was about $1,350 at list API prices, measured. Operator attention ran ~12–33 hours, from measured hands-on time at the low end to an estimate that counts supervision at the high, against a rough ~100–260 hours for a solo developer, a guess with ~160h as the base case.
That is the project in one line. What follows is the measured account of what it took: the cost, the time, the value against the alternative, and where the numbers are hard versus estimated.
The work is a single project, so treat everything here as one data point, not a law. Unusually, the whole project was instrumented. Every model call, every operator request, and every code change was logged, which makes this kind of cost and effort breakdown possible in a way it usually is not. It also means the cost and code figures come from artifacts, not estimates: the git history, the test suite, and the per-message usage logs that produced them all exist, and a separate agent verified the project's live data on a read-only path rather than the agent that wrote the application. The effort figures (operator hours, and the solo-developer baseline) are the soft exceptions, labeled inline.
A small tag on each figure marks how solid it is: measured means read straight from logs or artifacts; estimate is modeled from real signals; and guess means there is no firm baseline behind it. Green is hard, amber is soft.
01 The project
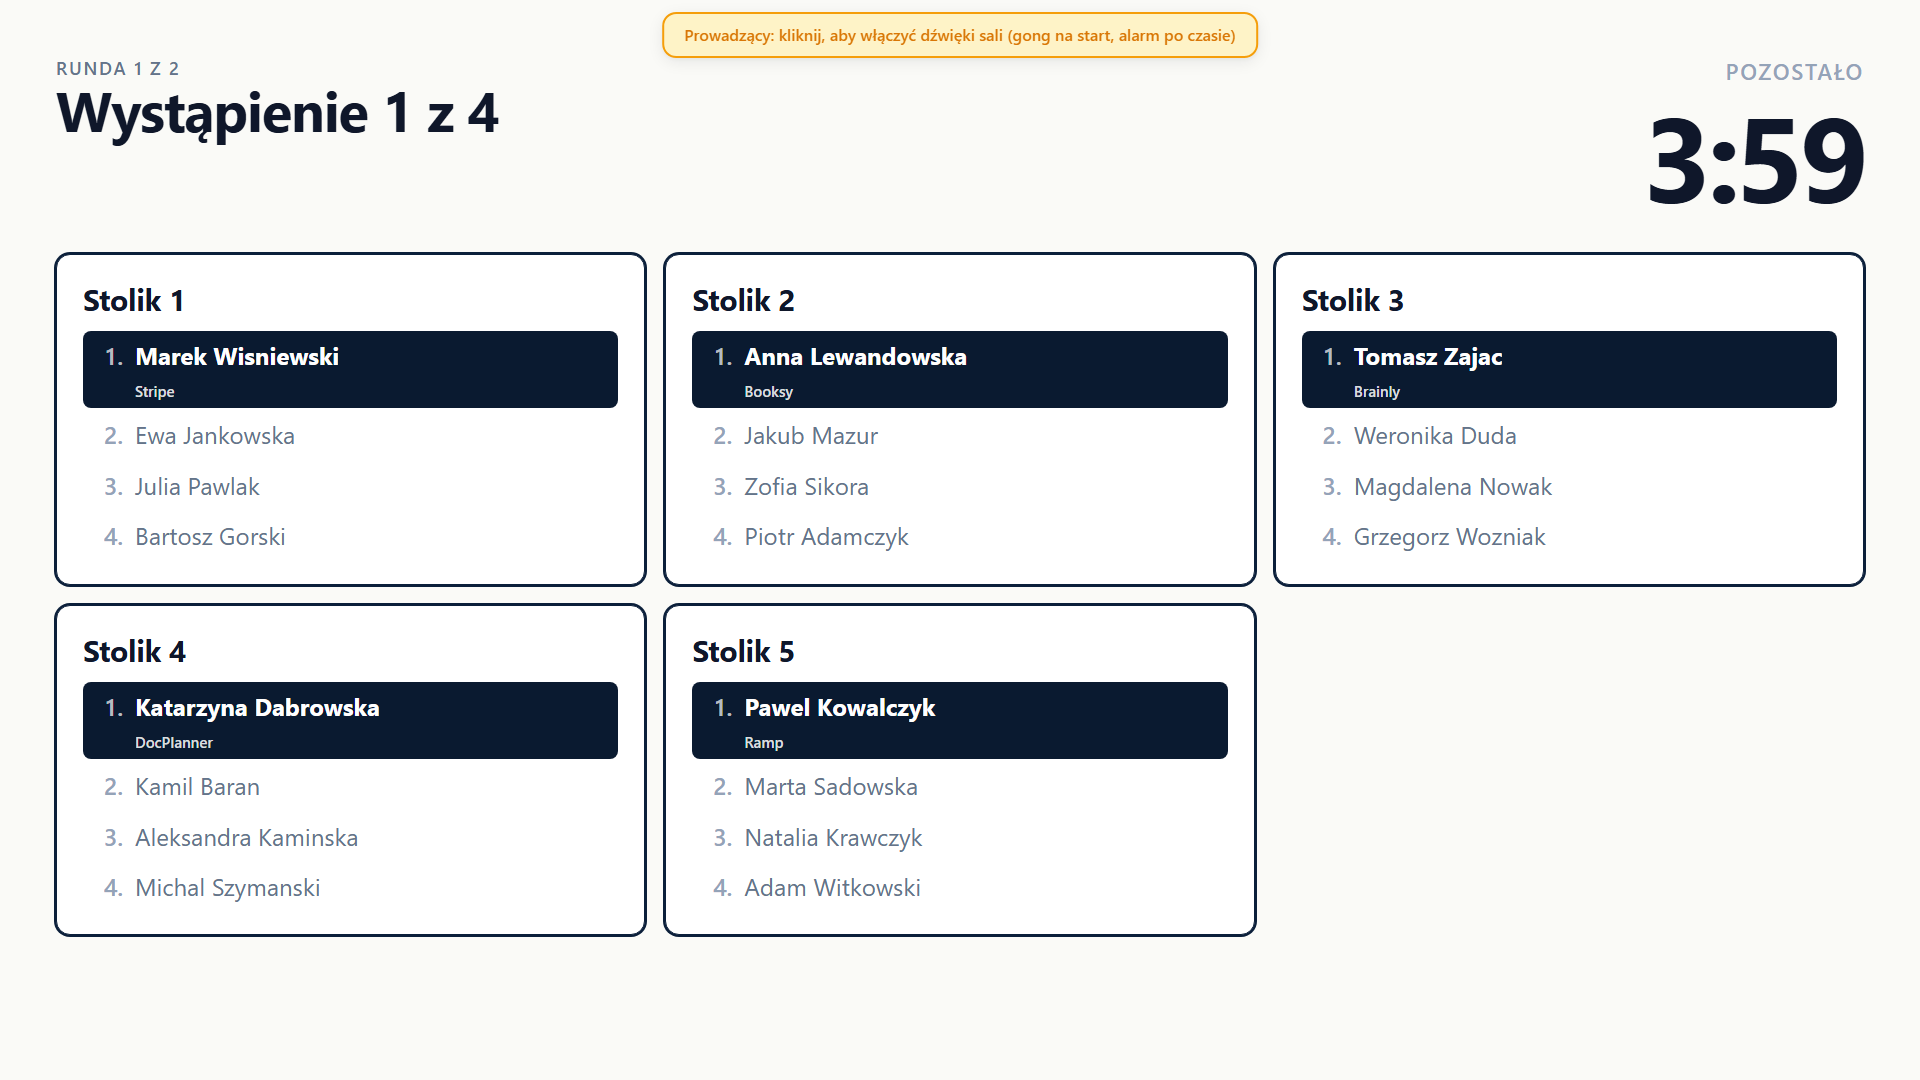
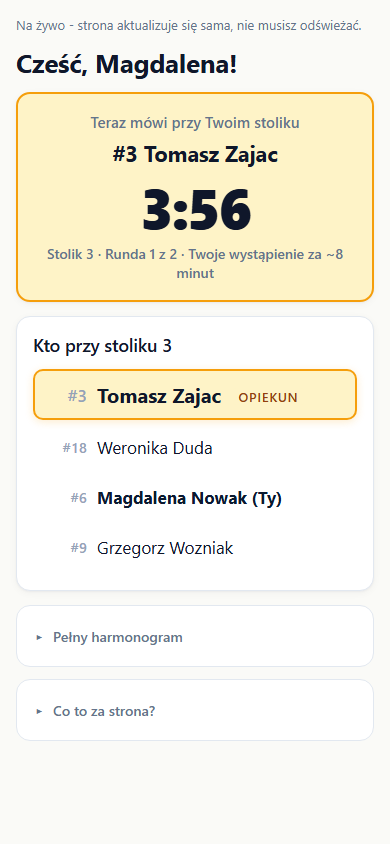
A Polish faith-based business community wanted a "table networking" segment for a June 2026 event: members rotate between small tables in timed rounds so that, over about an hour, everyone meets nearly everyone. The software had to import a guest list, generate QR badges, assign people to tables each round with no repeated pairings, drive a room screen, and collect feedback.
It was built in two stages. First a proof of concept, written and deployed live in a single session, enough to show the client the format worked. After the client approved, that became a hardened, reusable product. Two agents split the build on a fixed boundary: one owned the application code, the other owned the server and deployment. That boundary held cleanly through build, deploy, and the event itself, which is the clearest operational lesson here. The split also created a second check: the deployment agent read the live production database read-only to confirm the event's data, rather than relying on the application's own output.
The software was not the whole of it. A third agent produced the evidence base behind the format itself, reviewing the research on whether rotational speed-networking actually works. The short version: it is good for the number of first contacts and for breaking the cold-start problem, but the gains fade within months without a built-in follow-up, so the value is in the quantity of new connections, not their depth. Ahead of the event, that same agent also wrote the preparation materials sent out to attendees: a guide to preparing and delivering a useful self-introduction inside the three-minute slot, which is the format's hardest constraint, plus a facilitator guide for running the rotation. This strand was research and writing rather than code, and its cost is not included in the figures below.
What shipped
| Application code | ~8,950 lines | measured, excludes tests |
| Rotation solver | 523 lines | reliably produces zero repeat pairings (measured) |
| API endpoints | 17 | |
| Web app | 8 views | plus QR badge + document generation |
| Own test suite | ~5,000 lines | 45 files |
The UI was small (a handful of screens); most of the work sat in the rotation algorithm, the endpoints, the document generation, and the tests.
One part of the build was hardened in a way specific to code a model writes. A model can produce tests that pass while checking nothing, so a green suite and a high coverage figure prove little on their own. The tests here were held to a harder bar: each had to be shown to fail when the code it covers is deliberately broken (mutation testing), with the coverage percentage treated as the wrong target. A test that survives a planted bug is theatre, and was rewritten. After the event that check was wired in as a release gate: a mutation run that fails if too many planted bugs survive, run before a change ships rather than once.
02 The event
The event ran on a June evening. Around twenty people took part, rotating through five rounds so that everyone met new people each round, with no pair sitting together twice. The matching and room flow ran cleanly on the night.
The ratings later came back five out of five, but from a small, self-selected re-sample. A "bad origin" bug rejected every feedback submission during the event (roughly 79% of attendees tried), so that evening's feedback was lost for good; a handful re-rated the next day after an overnight fix, the failure caught in the production logs. The comments spoke to the goal. One attendee wrote: "I learned, in a short time, what the other members do for a living, and it helped me feel part of the group."
The live event was around twenty people; the engine was measured well past that, on three different bases. It was proven live at around twenty, load-tested end to end at about a hundred (zero repeat pairings, sub-second screen updates), and the pairing algorithm was benchmarked beyond 150 with no repeats. Three measurements, not one projected number.
03 What it cost
Model usage for building and running the app was about $1,350 measured, and it came in two stages. The proof of concept that won the client's approval was a separate, tiny first build, about two hours and ~$50 of model cost. The production rebuild that followed, plus the live event and the post-event hardening, accounted for the remaining ~$1,300 (the application code, and a smaller infrastructure-and-deploy slice owned by a second agent). One disclaimer matters before the figure travels any further: this is token usage valued at list API prices, not money that changed hands. The work actually ran under a flat-rate subscription, so $1,350 is what the same measured usage would have cost a project billed per API call, costed out as if it were fully commercial rather than an amount anyone paid. Read it as a list-price reconstruction, the way a commercial engagement would be priced, not an invoice. It also excludes operator time, infrastructure, and the later model spend of measuring and writing about the project itself (counting that would let the figure feed on its own tail). This was a one-time build cost: a second event needs only new configuration. A second, fully distinct instance (different branding, schedule, and tables) was stood up from configuration alone, with no changes to the application code.
The breakdown matters more than the total:
| Where the money went | Share |
|---|---|
| Building the application's features | 24% |
| The iteration loop (verify, fix, polish UX) | 45% |
| Post-event hardening (mutation-test gate, capacity, reusability) | 7% |
| Process overhead (sessions, retros, memory, task tracking) | 14% |
| Other | 10% |
These shares break down the ~$1,300 production rebuild; the separate proof-of-concept stage sits outside them. The largest slice was the iteration loop, not writing the features. Producing working code the first time is the cheap part; making it correct and usable is where the cost lives, and it is rarely this visible. A further slice went in after the live run (wiring in a mutation-test release gate and lifting capacity), so the next event runs on a hardened, reusable product rather than a one-off. The table regroups the underlying per-task logs for readability; post-event hardening is carved out as its own phase, not added on top of the iteration loop.
Two more measured patterns:
- Cost decouples from instruction length. A one-word "yes" cost $8.99; a single instruction that triggered an 88-minute autonomous run cost ~$70. What drives spend is how much work an instruction sets off, not how long the instruction is.
- Caching did most of the saving. Re-reading prior context at a tenth of the price did most of the saving: without it the same work would have run near $9,500 at list price, several times the figure above. The strongest model accounted for about 93% of the cost.
04 What it took in time
Wall-clock across all sessions was ~174 hours, but that counts every idle gap and overstates the real effort by three to six times. Two narrower measures sit underneath it:
| Measure | Hours | Basis |
|---|---|---|
| Model active work | ~51h | measured idle-threshold parameter |
| Operator hands-on | ~12h | measured interaction latency; caps long reviews |
| Operator attention, with supervision | ~33h | estimate assumes watching a third to half of model time |
The operator's time was not spent writing code. Their measured hands-on interaction was about ~12 hours of direction and review: setting goals, making calls, checking output. Counting the supervision around it (being available while the model works) pushes the figure toward ~33 hours, but that upper end assumes watching a third to a half of the model's active time, which agentic, multitasked work rarely does. Either way, at typical senior-developer rates the human hours are a real part of the total, plausibly rivalling the model cost at the upper end. The full cost of an agent-built project is the model spend plus the human hours, not the model spend alone.
05 Against the alternative
A single experienced full-stack developer, working without AI, might plausibly need somewhere in the ~100–260 hours guess range to build, deploy, test, and support the same thing, with ~160h as the base case. We can't stand behind it as a measurement: there was no controlled non-AI build, and honest estimates for work like this vary enormously. It is a bottom-up scope guess, broken out in the appendix, not a baseline we measured. The work sat in the rotation algorithm, the 17 endpoints, the document generation, and the test suite, not the screen count.
Set that against ~12–33 hours of operator attention. These are different units (one person's supervisory hours against another's full execution hours), so "N times faster on the clock" misreads it. Using the base case, ~160h against ~12–33h is something like five to thirteen times less human involvement, plus a shift in what the human does, from writing to supervising. Across the full ~100–260h range the multiple is too wide to headline. Don't put weight on it: the solo baseline is a guess and the attention figure is a range, an external model anchored higher on classic productivity literature, the operator argued lower, and the honest answer is we don't know. The firm part is the change in the human's role, not the number.
06 What this does and does not show
Read the bounds before the numbers
- One client app, real and live. Built, deployed, and run for ~$1,350 of model cost and ~12–33 hours of operator attention, against a ~100–260h solo-developer guess (base case ~160h) we can't stand behind.
- It does not generalize from here. One project (n=1), greenfield (new code, not changes to a large existing system), built by a mature agent setup, with a single operator.
- The task type matters. A 2025 controlled study found AI slowed experienced developers on mature codebases by 19%. This was the opposite kind of task (greenfield, not a large existing system), which is why the result runs the other way.
- Hard versus soft numbers. The dollar cost and the code measurements are measured. Operator attention runs from ~12h of measured hands-on interaction up to ~33h counting supervision, an estimate at the upper end; the solo baseline is a ~100–260h bottom-up guess (base case ~160h), not a measurement.
- The dollar figure is a list-price reconstruction. The work ran on a flat-rate subscription; $1,350 is what the measured usage would cost billed per API call, priced as a commercial engagement would be, not a delivery price, an invoice, or the amount actually paid.
The economics here are one well-instrumented data point: a real client app, a first live run that delivered, the hardening that followed, and a product now ready to run the next event from configuration alone. The next project is the second data point, and the open question is whether the cost band holds.
07 Appendix: how the solo-dev range was built
There was no controlled non-AI build, so the solo-developer figure cannot be measured. To make it more than a number pulled from the air, the scope was split into work packages, each given a low, base, and high estimate, and summed into a range with ~160h as the base case. It is still a guess: treat the spread, not the midpoint, as the honest signal.
| Work package | Low | Base | High |
|---|---|---|---|
| Requirements, event flow, client sign-off | 6h | 10h | 16h |
| Core app: data, guest import, views, API, flows | 32h | 50h | 80h |
| Rotation solver and edge cases | 12h | 24h | 45h |
| QR badges and document generation | 6h | 14h | 25h |
| Deploy, environment, live-event ops | 10h | 18h | 30h |
| Tests, hardening, mutation gate, capacity | 24h | 45h | 75h |
| Rounded total | ~100h | ~160h | ~260h |
Formal methods exist for this (function points, COCOMO), but they need fuller specification and calibration than a single case study warrants. The table is not precision; it shows the figure is a structured guess with stated assumptions, not a measured baseline.